One of the architecture pattern for breaking down a large monolithic application is a collection of loosely coupled fine-grained services (microservices) and packaging them as independent deployable units using containers and exposing the functionality through APIs. All communications between the services happens through the APIs.
With the microservices architecture pattern implemented, there are various cross cutting concerns that needs to be implemented, such as secure communication between services, collecting telemetry data, logging and monitoring, api throttling, traffic management, version management etc. These various functions can be decoupled from the actual application by employing a technology called Service Mesh. Service Mesh basically adds a sidecar proxy to your containers which intercepts all the request and adds the required functionality in a unified way. Open source tool like Istio provides these capabilities uniformly across a network of services.
Anthos provides Anthos Service Mesh, which is managed offering that leverage Istio and provides various other enterprise capabilities, operation agility and management of services across the Anthos environments.
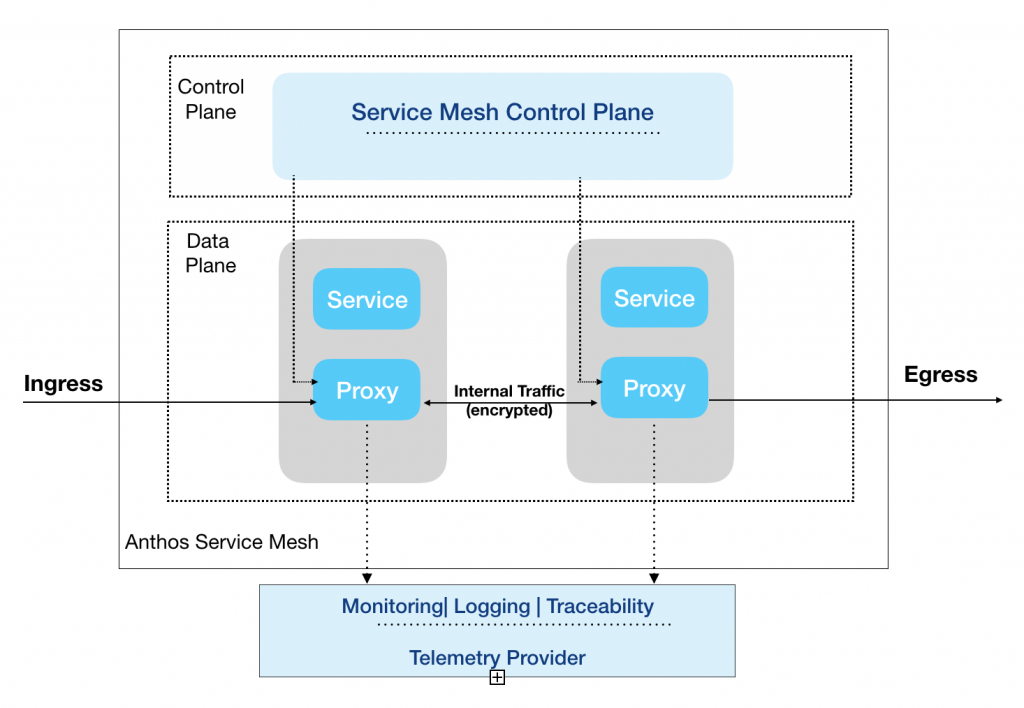
Following figure shows the component of Anthos Service Mesh.

The Service Mesh control plane provides centralized service discovery, encryption, authentication and authorization, traffic management and network security policies for your services. The proxy component get installed as a sidecar component along with your services in each pod as part of the service mesh installation. You can also selectively inject the proxy for required pods. All communicates between services now happens through the proxy which works in conjunction with the service mesh control plane to provide authentication, authorization, various network functions such as telemetric and traceability data transparently without any code modification to your services.
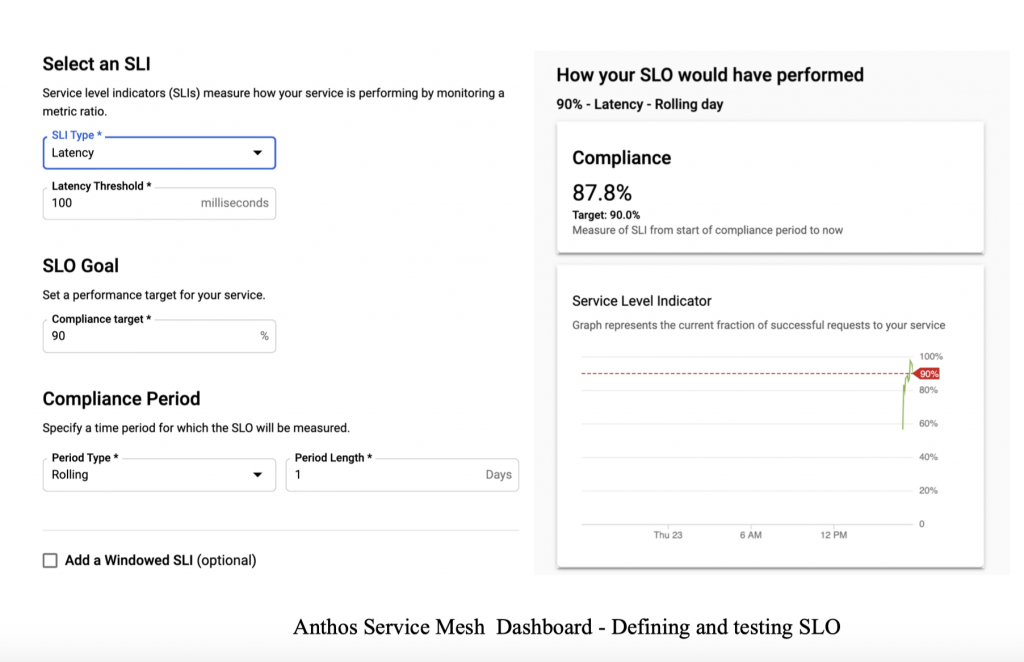
Once the data from your services are captured, the Anthos Service Mesh provides deep visibility for your microservices and their network interaction, allowing you to define and monitor service level options. Using this feature, you can define the required service level parameters( latency, availability etc) and thresholds for each your services and generate alerts to take corrective action. For instance, login service should be available 99.5% of the time.
Following figure shows the snippet of Anthos Service Mesh dashboard where you can select the Service level indicator (SLI) and define the Service level object (SLO) and can test your compliance against actual service data.

Anthos Service Mesh is supported on on-prem, bare metal and multi-cloud. However certain features of Anthos Service Mesh differs between the supported platform, for instance Cloud Monitoring is not available on VMware and Bare metal and you can use third party tools like Prometheus, Kiali, and Grafana dashboards in your environment.
We would go over Anthos Service Mesh in detail and various deployment options for installing Anthos Service Mesh during the course of this book