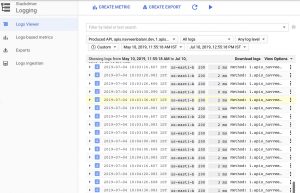
Once the micro services are running, you can monitor the production environment by inspecting the logs at various entry points. All the logs are available in Stack driver : Console (Stack Driver -> Logging -> Log Viewer) and you can filter specific logs by selecting the corresponding components from drop down. For instance, in the example below, I have selected logs for api.naveenbalani.dev endpoints for a given time duration

Following are the useful set of entry points for our application
- Using Cloud Armor – This is the entry point to our environment and using Cloud Armor we log every incoming request. You can view the complete incoming request in stack driver console as described earlier.
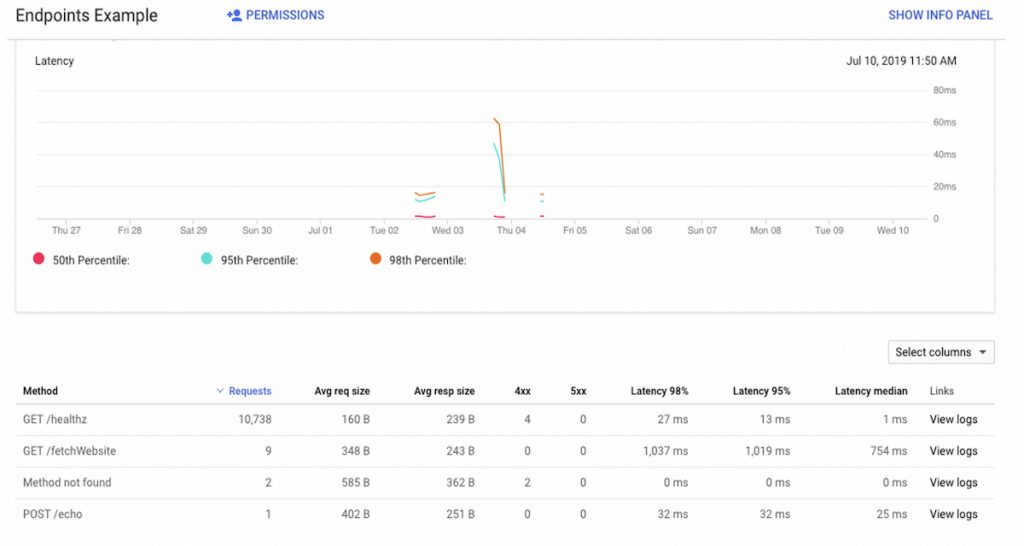
- To monitor endpoints, you can visit Endpoint – > Service and you would see various details about the endpoint, such as request size, latency, error for each of the APIs as shown below.

- Kubernetes Cluster Logs – All logs can be monitored through Stackdriver console by selecting Kubernetes – > <Region> -> <Kubernetes Cluster Name>. Kubernetes does not log your application logs. For your application logs, you can employ a sidecar logging agent (like fluentd) in your kubernetes cluster which streams our application logs to stackdriver. For more details, refer to this link- https://kubernetes.io/docs/concepts/cluster-administration/logging/#using-a-sidecar-container-with-the-logging-agent
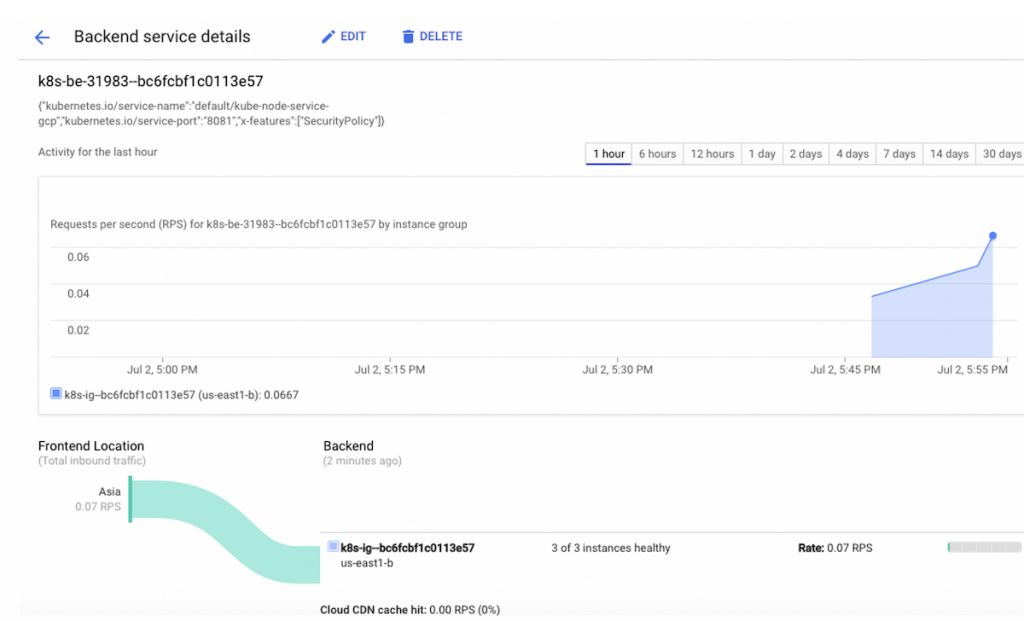
- VPC and Load balancer Logs – VPC logs records network flow for your VPC subnet. You typically enable this for auditing, monitoring and real-time security analysis. The load balancer logs gives you a view on how the load is being distributed. Following shows a a snapshot of the load balancing routing being applied and the selected target.
